Performance and Valuation Prime™ Chart
QCOM announced yesterday that they are planning on acquiring NXPI for $38.1bn. The goal in this acquisition for QCOM appears to be to expand from their maturing core wireless business to the growth opportunities of the Internet-of-Things. Their core wireless business remains strong with their combination of patent royalties and chip development and sales, but this business is maturing as the smart phone market in particular moves closer and closer to saturation globally.
As one of the largest M&A events of the year and ever in the semiconductor space, it is useful to understand not just the strategic rationale behind this event, but also the fundamental and valuation rationale behind the acquisition. By looking at what type of performance NXPI would have to produce in the future, based on our ROA’ and Asset’ growth framework, and also looking at how NXPI compares as a company relative to QCOM, in terms of that same framework, we can get a better sense of whether this acquisition makes sense or does not make sense.
Historically, QCOM has seen fairly robust, albeit somewhat cyclical, profitability, with consistent 20%+ ROA’ as the firm has benefited substantially from its licensing business. Meanwhile, the firm has seen fairly consistent Asset’ growth, positive in fourteen of the past sixteen years, while ranging from -6% to 39%.
From 2000-2006 ROA’ increased from 11% to 42%, before declining to 26% in 2010. While ROA’ recovered to 38% in 2013, it declined back to 26% in 2015 as the firm’s chip business saw profits squeezed. While management has made substantial progress in shoring up its licensing business in China, there remain reasons for concern. Handset volume growth remains volatile, and projections for ASP and royalty rates remain negative. Moreover, while the firm is preparing for the advent of 5G, the market remains saturated with little room for growth.
While it may be a bit early for overwhelming concern about the licensing business, the weakening state of the firm’s chip business does not help alleviate concerns. Competition within the space continues to compress margins, and the firm has lost important business to competitors, such as Intel winning baseband business from Apple (NASDAQ:AAPL). This has left the company looking for new growth catalysts and end markets as its core smartphone market begins to mature.
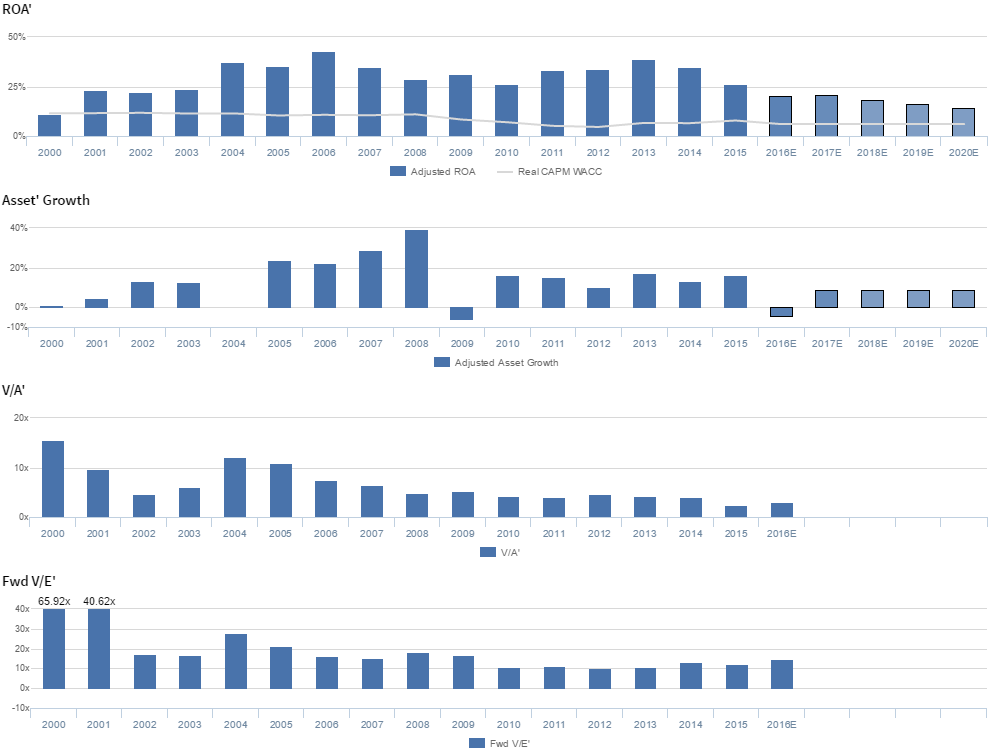
For context, the PVP chart below reflects the real, economic performance and valuation measures of QUALCOMM Incorporated (NASDAQ:QCOM) after making many major adjustments to the as-reported financials. This chart, along with all of the charts included in this article, as well as the detail behind the graphics, can be found here.
The four panels above explain the company’s historical corporate performance and valuation levels plus consensus estimates for forecast years as well as what the market is currently pricing in, in terms of expectations for profitability and growth.
The apostrophe after ROA’, Asset’, V/A’, and V/E’ is the symbol for “prime” which means “adjusted.” These calculations have been modified with comprehensive adjustments to remove as-reported earnings, asset, liability, and cash flow statement inconsistencies and distortions. To better understand the PVP chart and the following discussion, please refer to our guide here.
Performance Drivers – Sales, Margins and Turns
It can be helpful to break down ROA’ into its DuPont formula parts, Adjusted Earnings Margin (Earnings’ Margin) and Adjusted Asset Turnover (Asset’ Turns), which are cleaned up margins and turns metrics used to calculate ROA’. The chart below details both Earnings’ Margin and Asset’ Turns historically, to help us better understand the drivers of the firm’s profitability and performance.
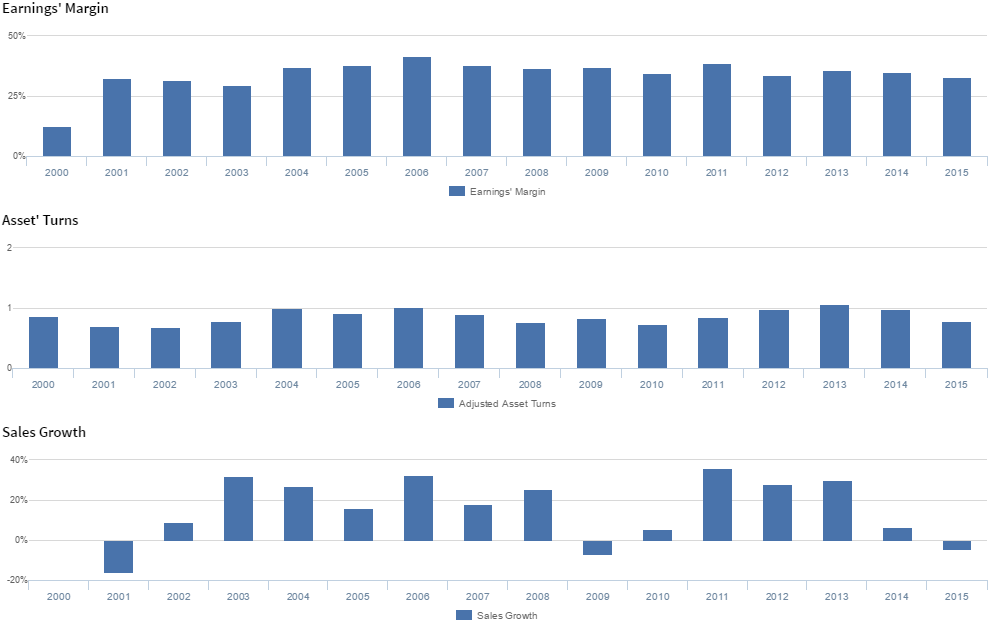
Trends in ROA’ have been driven by robust Earnings’ Margins, driven by the firms licensing business, and somewhat cyclical Asset’ Turns. From 2000-2006 Earnings’ Margins improved from 13% to 42%. Since then Earnings’ Margins have largely stabilized, ranging from 33-39%.
Meanwhile, Asset’ Turns have been more cyclical, rising from 0.7x in 2002 to 1.0x in 2006, before declining back to 0.7x in 2010. While Asset’ Turns subsequently recovered to 1.1x in 2013, they faded to 0.8x in 2015. As can be seen, these Asset’ Turns peak and valleys tend to line up with the biggest bulge of introduction of the new cell phone standards that QCOM supports. As 3G adoption grew in the mid 2000s, Asset’ Turns grew, as QCOM saw higher royalty revenues on their investment base, driving ROA’ higher. The same occurred after 2010, as developed and some developing markets pushed into 4G LTE, where QCOM also has a sizable patent portfolio to generate revenue off of. The 4G surge drove Asset’ Turns to an all-time peak for QCOM as ROA’ peaked in 2013, before fading as the growth cycle for the space slowed.
Embedded Expectations Analysis
As investors, understanding what the market is embedding in the stock price in terms of expectations is paramount to making good decisions. Without understanding what the market is pricing in, it is impossible to claim that the market is wrong. We derive market expectations for the firm from valuations and historical performance trends, to give a clearer picture into what the market is projecting for the firm.
QCOM is currently trading at a 14.7x V/E’, which is near historical averages. However, even at these levels, the market is pricing in expectations for substantial declines in ROA’, from 26% in 2015, already 14 year ROA’ trough levels, to 14% in 2020, accompanied by 9% Asset’ growth.
Analysts, however, have bullish expectations relative to the market, projecting ROA’ to only fall to 20-21% levels in 2016-2017, accompanied by 5% Asset’ shrinkage.
Acquisition Analysis – NXPI
On October 27th 2016, QCOM announced it would be acquiring NXP Semiconductors (NASDAQ:NXPI) for $38.1bn ($47bn for total transaction size), at a 32.2x V/E’. At $110 per share and $10bn for the firm’s outstanding debt, QCOM is essentially pricing in expectations for NXPI to see ROA’ increase to 20% levels, well above recent levels, and a far-cry from the consistent negative returns the firm saw from 2008-2011. This would indicate that the firm is pricing in a dramatic sustained future performance improvement for NXPI.
While QCOM has been a leader in the smartphone market, investors have become uneasy as that market has started to mature, forcing the firm to find a new catalyst for growth in its chip business. To this end, the acquisition of NXPI initially appears intelligent, with NXPI positioning itself as the leading provider of chips for the automotive market in recent years. Moreover, NXPI’s chips are used in a range of industrial applications and “internet-of-things” devices. However, considering NXPI’s historical performance, it may be challenging for this acquisition to provide the returns necessary to justify the price QCOM paid. It also does not appear likely to provide a serious boost to growth and profitability.
NXPI – ROA’ & Asset’ Growth
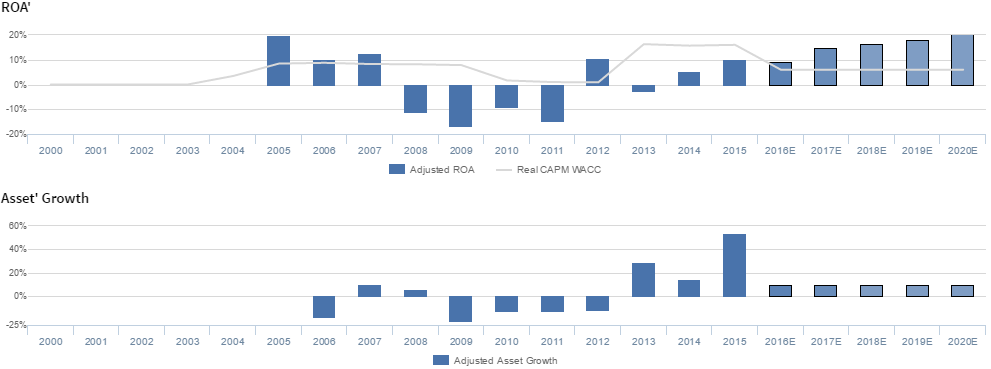
As we can see above, NXPI has historically struggled to sustain profitability at positive levels, with ROA’ declining from 20% in 2005 to -11% in 2008, and ranging from -9% to -17% from 2008-2011. While ROA’ experienced a positive inflection in 2012 to 10%, it subsequently collapsed back to -3% in 2013, before recovering to 10% in 2015. Meanwhile, from 2009-2012 the firm experienced Asset’ shrinkage ranging from 12-22%, before growing Assets’ again as their ROA’ inflected positively. In 2015 the firm acquired Freescale Semiconductor, in a bid to consolidate costs and expand market share, driving 53% Asset’ growth. Based on 2015 ROA’ and analysts forecasts for 2016, this looks like it may have helped them stabilize ROA’ at higher levels then the company has maintained historically. However, while this is likely to improve NXPI’s business, it is unlikely to drive the necessary improvements to justify QCOM’s acquisition price.
FSL – ROA’ & Asset’ Growth
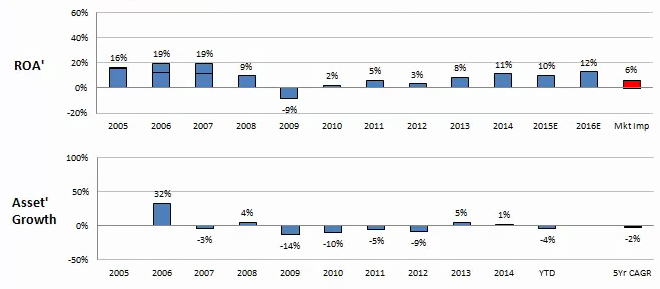
As we can see above, FSL, like NXPI, struggled with profitability in the 2009-2012 period. However, unlike NXPI, the firm has seen fairly stable double-digit returns outside of that period. While this may help stabilize and improve NXPI’s ROA’, it is unlikely that the combined firm, even with further cost savings from the integration with QCOM, will be able to achieve returns close to 20%. Even FSL, which clearly had a more resilient business than NXPI, has struggled in recent years as increasing competitive pressures within the space and supply/demand imbalance prevented ROA’ from recovering to its prior peaks. FSL has not seen ROA’ approach 20% since 2006-2007, which might as well be 1800 in semiconductor industry years. Even with the growth drivers for NXPI’s space in terms of IoT in particular, expecting these two businesses to see a doubling of ROA’ over the next several years from cost synergies and other benefits appears highly unlikely.
NXPI – Earnings’ Margins and Asset’ Turns
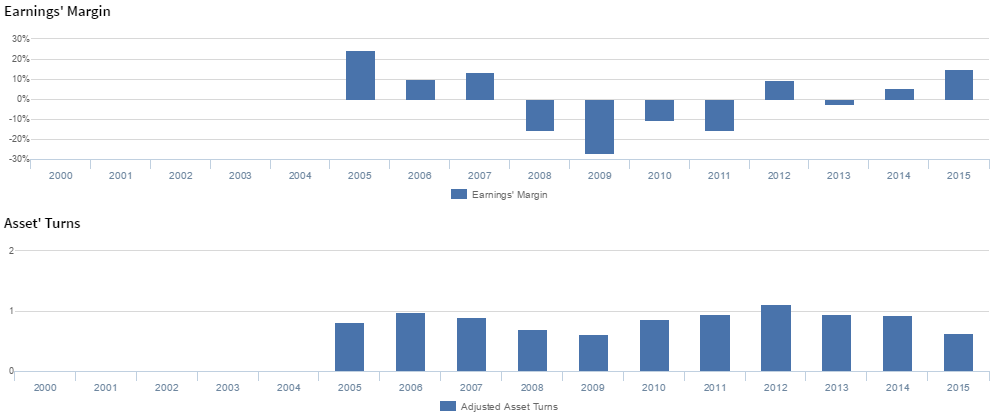
The potential impact of NXPI’s acquisition of FSL aside, from looking at NXPI’s performance drivers above, we can also see that there does not appear to be an incredible amount of opportunity for QCOM to improve NXPI’s business. The main driver behind NXPI’s volatile ROA’ has been Earnings’ Margins. From 2005-2008 Earnings’ Margins declined from 24% to -16%, and remained in negative territory, ranging from -10% to 27%, from 2008-2011. While Earnings’ Margins experienced a positive inflection to 9% in 2012, they fell back to -3% in 2013, before recovering to 15% in 2015. On the other hand, NXPI and QCOM have very similar Asset’ Turns levels.
While initially investors may believe there remains room for QCOM to improve NXPI’s historically weak margins, and, to a small extent, they may be correct, this ignores the main driver of QCOM’s more robust ROA’: their stable incredibly high margin licensing business. So while to a minor extent QCOM may help improve NXPI’s margins as they benefit from economies of scale and combine suppliers, it is impossible for either firm’s chip business to generate the robust margins that QCOM’s licensing business commands. This limits the operational synergies available to the firms, and thus limits the potential for material ROA’ expansion.
Combined Company
NXPI is projected to produce roughly $1bn of Earnings’ this year, relative to QCOM which is projected to produce roughly $6.4bn (down from $8.3bn last year) or $11bn and $31bn of Net Asset’ respectively. These metrics are all after the financial statements are adjusted to remove distortions around R&D expensing, stock option claim distortions, excess cash and other key issues that occur for companies in the technology space.
Assuming no synergies, the combined NXPI and QCOM would likely see ROA’ around 17.5%. QCOM has stated that they predict $500m of synergies from an acquisition. Assuming that is so, the combined company’s ROA’ would be around 19%. Either way, QCOM’s ROA’ after the acquisition is likely to be lower, though thanks to the growth opportunities of the smaller business they are acquiring, they should see steady growth.
Valuation Matrix – ROA’ and Asset’ Growth as Drivers of Valuation
When valuing a company, it is important to consider more than a single target price, and instead the potential value of a firm at various levels of performance. The below matrix highlights potential prices for QCOM at various levels of profitability (in terms of ROA’) and growth (Asset’ growth). Prices that are in excess of 10% equity upside are highlighted in black, and prices representing an excess of 10% equity downside are highlighted in red.
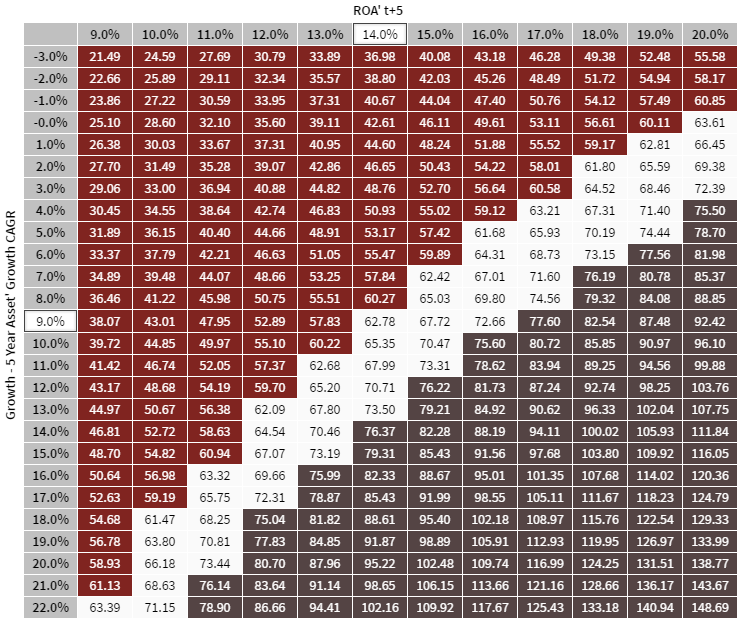
To justify current prices QCOM would need to see ROA’ compress from 26% to 14%, below QCOM’s projected 17.5-19% ROA’ post-acquisition, assuming they don’t see further ROA’ fade because of any declining royalties from their patent business. However, whether QCOM is fairly valued or not ignores a follow-on issue, which is the simple fact that not only did they vastly overpay for NXPI, they also are unlikely to succeed in improving that business enough to justify such a rich premium.
Moreover, while the acquisition may provide new end markets for QCOM, it is likely to increase the firm’s exposure to the much more volatile chip market, thus limiting the buffer provided by the firm’s stable, and more profitable, licensing business. This is just as likely to damage the firm’s future returns as continuing competition within the space compresses ROA’ for the entire industry.
To say simplistically, by overpaying for NXPI, QCOM is reducing how undervalued they are, while also creating more risk of volatility in their business which could further limit valuations. As such, this acquisition does not appear like a smart use of capital for QCOM.
To find out more about QUALCOMM Incorporate and how their performance and market expectations compare to peers, click here to access the open beta of the Valens Research database.
Our Chief Investment Strategist, Joel Litman, chairs the Valens Equities and Credit Research Committees, which are responsible for this article. Professor Litman is regarded around the world for his expertise in forensic accounting and “forensic fundamental” analysis, particularly in corporate performance and valuation.
Disclosure: I/we have no positions in any stocks mentioned, and no plans to initiate any positions within the next 72 hours.
I wrote this article myself, and it expresses my own opinions. I am not receiving compensation for it (other than from Seeking Alpha). I have no business relationship with any company whose stock is mentioned in this article.