Amongst all of the things in our digital lives there’s one that’s increased exponentially over the last few years: Status data. Even though many services and devices are highly reliable we still need to keep an eye on everything so we need to monitor our network connections for availability and throughput, our servers and web apps for status, our log files for errors, our sales systems for orders, our trouble ticket systems for backlogs … the list grows every day and because each data source is a silo, we wind up with a ridiculous number of isolated status reports to routinely check . What we need is a dashboard to integrate all of our data sources.
Now, there are a number of products that allow you to implement web dashboards but many of the really good ones are extremely complex and expensive while the others are usually limited in what they can do. If you’ve been looking for a reasonably priced, easy to implement solution to your web dashboard (or, rather, lack of web dashboard) problem, I have a great answer …
The project is called Freeboard and was developed by Bug Labs, the creators of a powerful service called dweet, a messaging service designed for Internet of Things devices (I’ll cover dweet in a future article). Freeboard is a free, open source dashboard project with optional hosted subscriptions that’s easy to integrate with diverse data sources, production ready, and elegantly designed
You can test easily Freeboard using either Bug Labs hosted service with a free account or locally in your own environment. To do the latter, simply download a copy of Freeboard, unpack the archive, and load the file index.html in your browser.
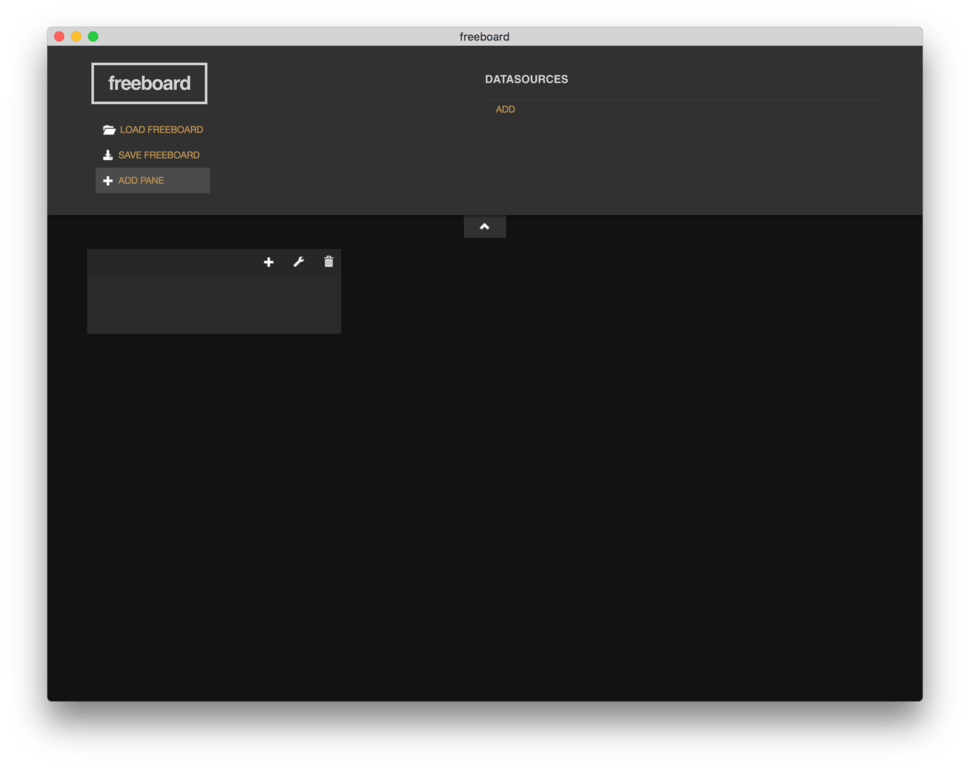
Freeboard is organized as a canvas with a configuration panel above. The Datasources menu at the top left of the configuration panel is where you add the sources of data for widgets to display. In the downloaded version you can include JSON data from a URL, call the Open Weather Map API, retrieve data from Bug Labs’ dweet.io service, playback a list a JSON data from a file URL, get date and time data, and retrieve data from Citrix’ Octoblu service (another IoT platform I’ll be covering).
As an aside, check out the Freeboard online tutorial (you need to sign up for at least a free subscription). The demo uses dweet running from a web page to send the X-, Y-, and Z-axis gyro data from your smartphone to dashboard controls in more or less real time. In the screenshot at the top of this post, the three gauges are displaying my iPhone’s orientation. How geeky is that?!
The online version also adds support for retrieving data from BuildingLink (a premises management IoT platform), dweet storage (long term storage of dweet data), FIWARE Orion (an NGSI9/10 server implementation which “allows you to manage all the whole lifecycle of context information including updates, queries, registrations and subscriptions”), PubNub (real time device messaging with programmable middleware), weather (this uses the excellent simpleWeather jQuery plugin), and Xively (another comprehensive IoT support services platform).
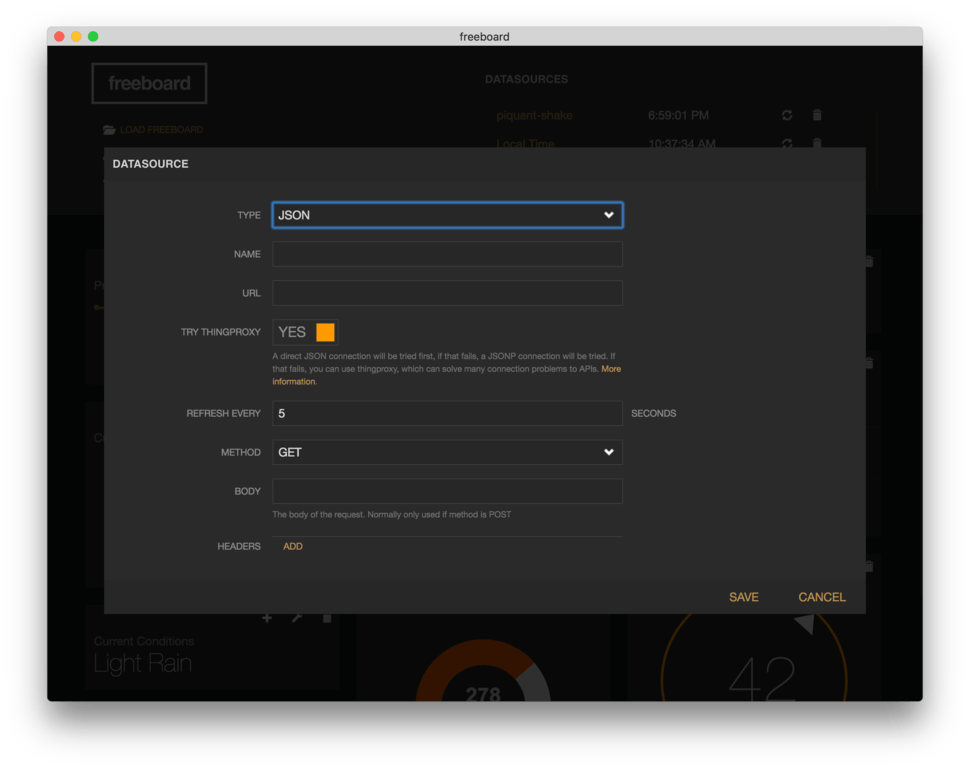
For each datasource, you set the various parameters and, for most source types, the refresh frequency. An option, for most datasources, is to allow Bug Labs’ Thingproxy to attempt to handle the data to resolve any API connection problems (note that, as of writing, the link in the Freeboard UI to Thingproxy gives a 404; my link is correct). Thingproxy is described as …
A simple forward proxy server for processing API calls to servers that don’t send CORS headers or support HTTPS …simple forward proxy server for processing API calls to servers that don’t send [cross-origin resource sharing (CORS)] headers or support HTTPS … thingproxy allows javascript code on your site to access resources on other domains that would normally be blocked due to the same-origin policy. It acts as a proxy between your browser and a remote server and adds the proper CORS headers to the response.
In addition, some browsers don’t allow requests for non-encrypted HTTP data if the page itself is loaded from HTTPS. thingproxy also allows you to access non-secure HTTP API’s from a secure HTTPS url.
… and while Bug Labs encourages you to run your own Thingproxy server, the company makes a public service available for free.
Be warned, the documentation and error reporting for Freeboard is pretty much non-existant so things like datasource incompatibility problems won’t be flagged and you’ll need to get creative when debugging a non-working datasource (I speak from experience from trying to sort out why JSON generated by a Node-Red flow wasn’t being displayed).
The left hand menu of the user interface allows you load and save configurations and add panes to the display area. As you can see, I’ve added a pane and named it “PANE 1”. My pane is one column wide but you can choose whatever width suits the layout of your data widgets.
The widgets included in the download version of Freeboard are text, gauge, sparkline, pointer, picture, indicator light (an on or off display, great for server and service status reporting), Google Maps, and HTML, while the online hosted version adds an historical chart widget to display either a bar chart or a line graph of a datasource; hopefully this last widget will be included in a future version of the downloadable version.
You add a widget to the dashboard by clicking on the plus sign in a panel and selecting the type of widget, its title, size, and value. The value can be derived from a datasource you configured or you can add JavaScript to the widget to do whatever you want and set the widget accordingly. A nice feature of text-based widgets is an option to animate the display so that when a value changes, it uses smooth transitions. Once the widget is configured, it is immediately live.
When you’ve set up all of your widgets and dragged them to where you want them located on the canvas, you can hide the top configuration panel by clicking on the caret icon at the bottom of the panel and voila! A tidy, well designed, highly flexible responsive web dashboard with all of the configuration controls hidden except for a wrench icon to display the configuration panel. In the hosted version there is no user access to the configuration panel.
In the “Things I’d like to See” department are when the configuration panel is closed I’d like to see the widgets shielded so their content can’t be accidentally selected (people, particularly noobs, often click on dashboards while looking at them and can’t figure out why they’ve made a selection they can’t do anything with). I’d also like to see sounds associated with high and low threshold values, and pop up widgets so you can drill down into datasources.
Freeboard offers a free subscription which allows for unlimited data and devices, unlimited widgets, and unlimited dashboards although all of your dashboards are public (that said, you do have to know the URL of a dashboard to view it). Paid Freeboard subscriptions include the features of the free subscription as well as provide private password protected dashboards. You get 5 private dashboard for $12 per month, 10 for $22 per month, 20 for $42 per month, and 50 for $100 per month. Enterprise pricing is on request.
My wish list notwithstanding, Freeboard is an excellent and practical platform for building anything from small to enterprise scale web dashboards for Internet of Things systems or for monitoring of any system or service that provides any kind of data feed. Freeboard gets a Gearhead rating of 4.5 out of 5.
Comments? Thoughts? Drop me a line or comment below then follow me on Twitter and Facebook.
Pingback: Homepage